Creative Technologies Design Challenge 8: Data Visualization
This is the eighth design challange in the Creative Technologies class (fall 2019). Students are required to visualize a data set that have at least 100 data points.
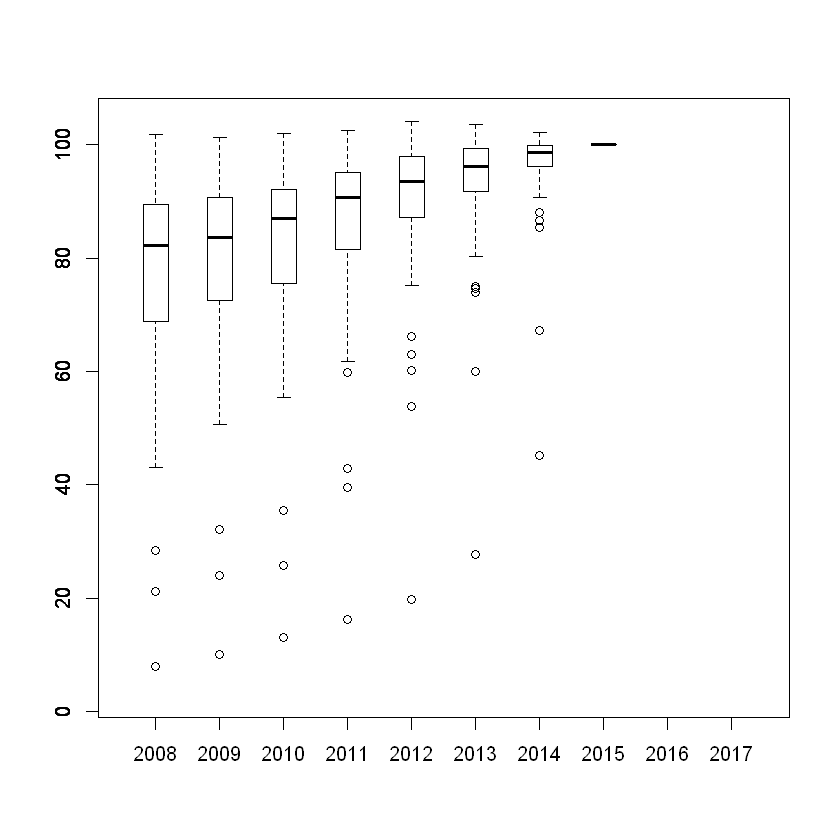
I am using both R and p5.js to analyze this data set of the world energy prices, and here are the results: